Logging JSON to Greylogs (in Silverstripe)
Just some quick code for easily logging JSON data which you can then query in Greylogs
When logging data as one string to Greylogs it's quite often hard to query important parts of that data in a structured way. This post will walk you through getting your log messages into a structured manor and make use of Greylogs new graphing functionality.
Let's first start with the method for logging the data to Greylogs. In our case we're using Silverstripe Cloud for hosting. So we know that anything added to syslog will be picked up in Greylogs (Your case might be different so you might need to explicitly point to a log file).
In this specific example I'm going to detail how we log data from the queued jobs module as a real world use case.
So first we start with a Logger class which will handle logging:
<?php

namespace App\Metrics;

use App\Metrics\Snapshot\Snapshot;
use Monolog\Formatter\LineFormatter;
use Monolog\Handler\SyslogHandler;
use Monolog\Logger as BaseLogger;
use Psr\Log\LoggerInterface;
use SilverStripe\Core\Injector\Injector;

/*
 * Really basic logger
 */
final class Logger
{
    private const HANDLER_IDENT = 'SilverStripe_log';

    // We'll add more onto this in a moment
    public static function logSnapshot(Snapshot $snapshot): void
    {
        // We force a JSON object as Greylogs only supports objects
        self::toSyslog(json_encode($snapshot->generateArray(), JSON_FORCE_OBJECT));
    }

    /*
     * Logs only the message to info on the syslog
     */
    private static function toSyslog(string $message): void
    {
        /** @var BaseLogger $logger */
        $logger = Injector::inst()->get(LoggerInterface::class);
        $existingHandlers = $logger->getHandlers();

        // We push a handler onto the logger which will only print the message rather than:
        // %channel%.%level_name%: %message% %context% %extra%
        // This means we can consume the logged message as JSON
        $handler = new SyslogHandler(self::HANDLER_IDENT);
        $handler->setFormatter(new LineFormatter('%message%'));
        $logger->setHandlers([$handler]);

        // Log the info and then set the handlers back to what was set previously
        $logger->info($message);
        $logger->setHandlers($existingHandlers);
    }
}
With this we now have a logger which we can use, we could replace the logSnapshot function with the following to log array data:
<?php

public static function log(array $data): void
{
    self::toSyslog(json_encode($data, JSON_FORCE_OBJECT));
}
Alright we now have a method to log data as JSON, lets look at adding it to the queued jobs module. We've created a basic snapshot interface like follows:
<?php

namespace App\Metrics\Snapshot;

interface Snapshot
{
    /*
     * An array of data which can be consumed by loggers etc
     */
    public function generateArray(): array;
}
Since we're going to be passing our snapshots to the logger we want to be able convert them to an array which can be then encoded into JSON.
For the queue snapshot I'll document the basic outline but leave out a chunk of the logic for determining the values:
<?php

namespace App\Metrics\Snapshot;

use SilverStripe\ORM\Queries\SQLSelect;
use Symbiote\QueuedJobs\Services\QueuedJob;

class QueueSnapshot implements Snapshot
{
    public function generateArray(): array
    {
        $snapshot = [];
        // To maintain a flat structure we merge the arrays
        // as we know we've set the keys to be unique
        // We do this because Graylog doesn't support arrays :sad-panda:
        $snapshot = array_merge($this->getJobsCreated(), $snapshot);
        $snapshot = array_merge($this->getCompletedJobDurationByType(), $snapshot);
        $snapshot = array_merge($this->getCompletedJobsCountByType(), $snapshot);
        $snapshot = array_merge($this->getBasicStats(), $snapshot);
        $snapshot = array_merge($this->getJobsCompletedByQueue(), $snapshot);

        // Group together the jobs and their data for easier readability
        ksort($snapshot);

        return $snapshot;
    }

    /*
     * The amount of completed jobs for this period
     */
    private function getCompletedJobsCountByType(): array
    {
        $results = [];

        foreach ($this->getCompletedJobs() as $completedJob) {
            $className = self::generateClassName(
                $completedJob['Implementation'],
                'completed'
            );
            $results[$className] = $completedJob['count'];
        }

        return $results;
    }

    /*
     * Helper to get the completed jobs, we also cache it as we use it a few times
     */
    private function getCompletedJobs(): Iterator
    {
        if ($this->completedJobsCache !== null) {
            return $this->completedJobsCache;
        }

        // Job durations completed in this time frame
        $query = SQLSelect::create(
            'Implementation,
                SUM(UNIX_TIMESTAMP(JobFinished) - UNIX_TIMESTAMP(COALESCE(JobRestarted, JobStarted))) as duration,
                COUNT(*) as count',
            'QueuedJobDescriptor',
            [
                'JobFinished >= ?' => $this->getStartDate(),
                'JobFinished <= ?' => $this->getEndDate(),
                'JobStatus' => QueuedJob::STATUS_COMPLETE,
            ],
            ['duration' => 'DESC'],
            ['JobTitle']
        );

        $this->completedJobsCache = $query->execute();

        return $this->completedJobsCache;
    }

    /*
     * Basic function to turn App/ClassName into App_ClassName_Measurement
     */
    private static function generateClassName(
        string $implementation,
        string $measurement
    ): string {
        return str_replace(
            '\\',
            '_',
            $implementation . '_' . $measurement
        );
    }
}
We then need to ensure that we're taking these snapshots at a determined time. For this we'll use a task that runs every 5 minutes.
<?php

namespace App\Queue\Metrics;

use App\Queue\Metrics\Snapshot\QueueSnapshot;
use Exception;
use SilverStripe\Control\HTTPRequest;
use SilverStripe\Core\Environment;
use SilverStripe\Dev\BuildTask;

class SnapshotTask extends BuildTask
{
    // Changing this should be well thought out on how it impacts the existing log entries/graphs
    private const REPORT_SEGMENT_SIZE = '-5 minutes';

    /**
     * @var string
     */
    private static $segment = 'queue-health-check';

    /**
     * @var string
     */
    protected $description = 'Queue health check (creates a log entry for the last 5 minutes)';

    /**
     * @param HTTPRequest $request
     */
    public function run($request) // phpcs:ignore SlevomatCodingStandard.TypeHints
    {
        if (Environment::isCli() === false) {
            echo 'This is meant to be run via CLI';

            return;
        }

        $startDate = date('Y-m-d H:i:s', strtotime(self::REPORT_SEGMENT_SIZE));
        $endDate = date('Y-m-d H:i:s', time());

        $queueSnapshot = new QueueSnapshot($startDate, $endDate);
        Logger::log($queueSnapshot);
    }
}
It's also at this point that you could create a DataObject that also records the queue snapshot for later referring to in the CMS or for reporting on the health of the queue (You could use the environment check package)
With this we now have the data being logged in Greylogs and accessible in there.
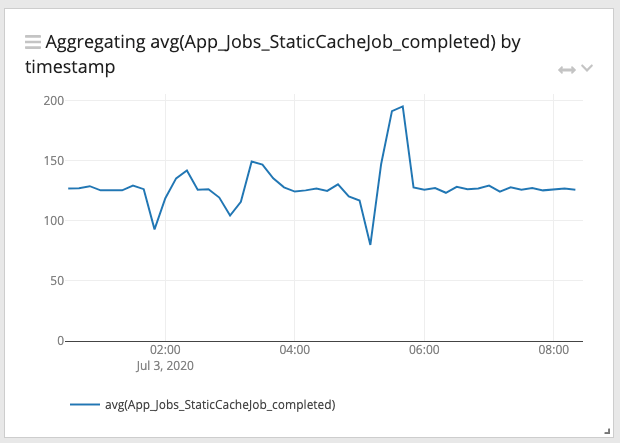
First we can query for our completed jobs by querying for App_Jobs_StaticCacheJob_completed* which will show us all the logs that contain completed static cache jobs. You can then view that data and graph it like follows: